Robobot mission
| Line 41: | Line 41: | ||
The name of the logfile will include date and time, and will therefore not overwrite the previous logfile. | The name of the logfile will include date and time, and will therefore not overwrite the previous logfile. | ||
| − | The IR logfile could be named ' | + | The IR logfile could be named 'log_irdist_20191227_095545.054.txt' look like this: |
| + | % robobot mission IR distance log | ||
| + | % 1 Timestamp in seconds | ||
| + | % 2 IR 1 distance [meter] | ||
| + | % 3 IR 2 distance [meter] | ||
| + | % 4 IR 1 raw [AD value] | ||
| + | % 5 IR 2 raw [AD value] | ||
| + | 1577436945.093 0.197 0.436 44943 15573 | ||
| + | 1577436945.139 0.197 0.421 44925 16430 | ||
| + | 1577436945.180 0.197 0.416 44896 16768 | ||
| + | 1577436945.225 0.196 0.410 44996 17123 | ||
| + | 1577436945.266 0.197 0.404 44922 17463 | ||
| + | 1577436945.311 0.197 0.423 44920 16341 | ||
| + | And can be displayed in MATLAB using a script like this | ||
| + | data = load('log_irdist_20191227_095545.054.txt'); % filter 23.5k || 330nF | ||
| + | h = figure(200) | ||
| + | hold off | ||
| + | plot(data(:,1) - data(1,1), data(:,2)) | ||
| + | hold on | ||
| + | plot(data(:,1) - data(1,1), data(:,3)) | ||
| + | grid on | ||
| + | legend('IR1', 'IR2') | ||
| + | xlabel('sec') | ||
| + | ylabel('distance [m]') | ||
| + | saveas(h, 'ir_plot.png') | ||
| + | And in this case, the plot shows: | ||
| + | |||
| + | [[File:ir_plot.png]] | ||
| + | |||
| + | The plot shows that longer distances (IR2) have more noise than short distances (IR1). | ||
== Bridge == | == Bridge == | ||
Revision as of 18:11, 27 December 2019
Back to [robobot]]
Contents |
Robobot mission software
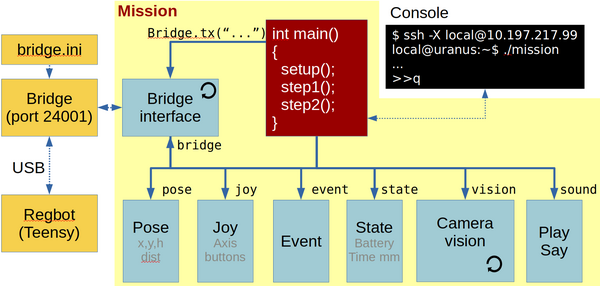
This figure shows the mission functional blocks. The main connection is to the robobot_bridge, through which the robot is controlled. The red mission block is the main block, where the behaviour is controlled. To help decide and control the behaviour, there is a number of data elements available in the bottom row of boxes, in addition a camera interface is available, where camera frames are available. the camera interface has further a support feature that extracts ArUco markers from the image and delivers the position and orientation of any found markers.
The blocks marked with a circle arrow is running their own thread. The yellow boxes are features available outside the mission application.
Main
The main block is the entry point of the application. This block creates all the other blocks, and if there is a successful connection to the robobot_bridge, then the mission thread is started, and the main thread now just listens for keyboard input.
The keyboard input (console input) can be used to get status of the individual blocks and issue some simple (mostly debugging) commands.
Press h (and enter) to get a list of features:
>> h
# got 'h' n=1
# mission command options
#    h    This help
#    a    Do an ArUco analysis of a frame (no debug - faster)
#    d    Do an ArUco analysis of a frame (with debug images)
#    c    Capture an image and save to disk (image*.png)
#    o    Loop-test for steady ArUco marker (makes logfile)
#    t 99 Camera tilt degrees (positive down), is 10.0 deg
#    p 99 Camera pan (Yaw) degrees (positive CCV) is 0.0 deg
#    lo xxx  Open log for xxx (pose 0, hbt 0, bridge 0, imu 0
#               ir 0, motor 0, joy 0, event 0, cam 0, aruco 1)
#    lc xxx  Close log for xxx
#    s    Status (all)
#    q    Quit now
Logfiles
Most of the data blocks have a data logger feature that can be enabled and disabled. The interface logfile will be in a text format for MATLAB import. The name of the logfile will include date and time, and will therefore not overwrite the previous logfile.
The IR logfile could be named 'log_irdist_20191227_095545.054.txt' look like this:
% robobot mission IR distance log
% 1 Timestamp in seconds
% 2 IR 1 distance [meter]
% 3 IR 2 distance [meter]
% 4 IR 1 raw [AD value]
% 5 IR 2 raw [AD value]
1577436945.093 0.197 0.436 44943 15573
1577436945.139 0.197 0.421 44925 16430
1577436945.180 0.197 0.416 44896 16768
1577436945.225 0.196 0.410 44996 17123
1577436945.266 0.197 0.404 44922 17463
1577436945.311 0.197 0.423 44920 16341
And can be displayed in MATLAB using a script like this
data = load('log_irdist_20191227_095545.054.txt'); % filter 23.5k || 330nF
h = figure(200)
hold off
plot(data(:,1) - data(1,1), data(:,2))
hold on
plot(data(:,1) - data(1,1), data(:,3))
grid on
legend('IR1', 'IR2')
xlabel('sec')
ylabel('distance [m]')
saveas(h, 'ir_plot.png')
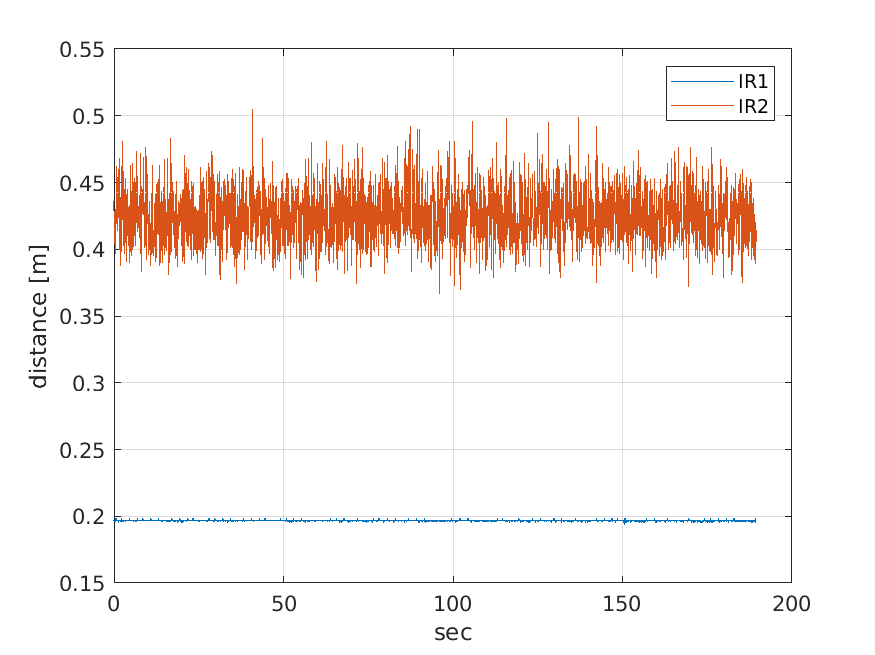
And in this case, the plot shows:
The plot shows that longer distances (IR2) have more noise than short distances (IR1).
Bridge
This part handles the interface with the regbot_bridge application. This two-way communication handles each direction individually.
Sending messages is mostly handled by the mission block, here regular updates of data is requested for the data blocks - e.g. robot pose, joystick buttons, IR-sensor measurements etc.
The receiving part of the bridge is always waiting for messages and distribute them for the relevant data block for decoding.
In a normal setup, about 150 messages will be received each second.

